No length of bitcoin DCA guarantees you won't lose
The longer the horizon, the fewer start months finish at a loss, yet the worst group in all four buckets ended in 2022, and one plan was 51.3% down on paper at one point. Whether you'd keep paying through a stretch like that decides the outcome before the number of years does.
Using Binance's BTCUSDT monthly candles from August 2017 to September 2026, with the same amount bought at every month-end close: after one full year of buying, about three in ten start months were still underwater; after three years, 8.0%; after four years, not a single start month in this data finished at a loss.
The four-year bucket has only 63 start months, and the market they cover amounts to roughly two bull-and-bear cycles. It says nothing about what comes next.
What share of start months were still losing after one to four years
The method: pick a start month, then buy the same amount of bitcoin at that month's closing price every month for 12, 24, 36 or 48 months. In the month of the last purchase, value the holdings at that month's close; if they're worth less than the total put in, the start month counts as "still down at the end". Start months begin in August 2017 (the pair's first monthly candle on Binance) and move forward one month at a time until the last purchase lands in September 2026, so the longer the horizon, the fewer start months qualify. Prices are the monthly candles from Binance's public market data API, with months split in UTC.
| How long you kept buying | Start months | Still down at the end | Share | Worst start month | How the worst group ended |
|---|---|---|---|---|---|
| 12 months | 99 | 30 | 30.3% | July 2021 | Ended June 2022, −49.6% |
| 24 months | 87 | 22 | 25.3% | January 2021 | Ended December 2022, −47.8% |
| 36 months | 75 | 6 | 8.0% | January 2020 | Ended December 2022, −13.0% |
| 48 months | 63 | 0 | 0% | January 2019 | Ended December 2022, +30.7% |
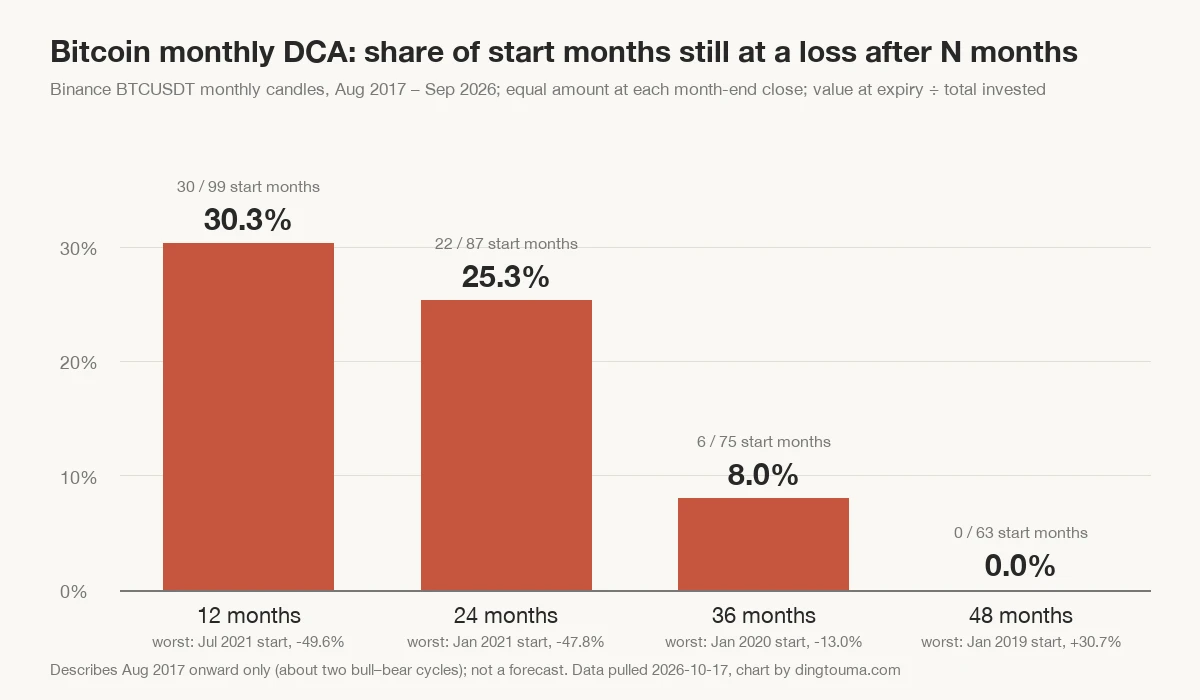
Between one year and two, the share still down only moves from 30.3% to 25.3%. The big gap opens in year three, from 25.3% to 8.0%.
The 30 losing start months in the one-year bucket bunch up in three stretches: September 2017 to April 2018; February 2021 to February 2022 (the April 2021 group being the one that wasn't down); and December 2024 to August 2025. The one left over is April 2019.
In all four buckets, the worst group ended in 2022: once in June and three times in December. The weakest 48-month group, which started in January 2019, also ended in December 2022. A longer horizon spreads the damage from paying too much in the first few months across dozens of later purchases; the price in the final month, though, is applied to the whole position at once.
How deep the paper loss went for groups that ended in profit
The end result only looks at the last month, yet the balance still has to be lived through one month at a time for every month before it. The deepest paper loss along the way in this data belongs to the group that started in February 2021: in one month, at that month's close, the holdings were worth just 48.7% of what had gone in, an unrealized loss of 51.3%.
That group was still down at the 24-month mark; by 36 months it had dropped off the loss list; and the 48-month bucket had no losing start months at all. So this plan did recover, on one condition: through the months when the balance had been cut in half and money still had to go in every month, the person neither stopped nor sold.
The worst one-year group, starting July 2021, ended at −49.6%: twelve portions of money went in, and at the end they were worth a little over six. Before you settle on a horizon, ask yourself whether you could watch the account lose half and still let next month's payment go through. If you can't say, cut each payment down to a size that wouldn't touch your day-to-day life even then.
Stop buying during a drawdown and the monthly candles will show exactly which purchases you missed and how far apart the end results land. Stopping, skipping a few months and carrying on settle differently over the same stretch of market.
Zero losses at four years holds only for this stretch of data
The 63 start months in the 48-month bucket run from August 2017 at the earliest to October 2022 at the latest. Any start month from November 2022 onward hadn't completed four years by September 2026, so it isn't counted.
Nor are these 63 groups 63 independent trials. Two neighbouring start months share 47 of their 48 purchase prices; only the first and the last month differ. The whole run of monthly candles from 2017 to 2026 covers roughly two bull-and-bear cycles, so the four-year results are really a few dozen ways of slicing those two cycles.
If a decline deeper and longer than anything in these nine years comes along, a four-year plan ending at a loss is entirely possible. This data simply never ran into one.
Why lump-sum holding-period stats don't apply to DCA
Holding-period figures built on "buy everything on one day and hold for N years" describe a different account from DCA. In a 48-month DCA plan, the first purchase spends 47 months in the market, while the last one is valued in the same month it's bought: zero months.
Averaged across all 48 purchases, each payment spends (0 + 1 + … + 47) ÷ 48 = 23.5 months in the market. Measured by how long the money is actually invested, "four years of DCA" comes to less than two.
A lump sum held for four years has every dollar in for the full four years, with none of the swings spread out. The "how many years until you stop losing" figures from the two methods can't be borrowed from each other.
The US Financial Industry Regulatory Authority (FINRA) says in its investor guide to dollar-cost averaging that holding money as cash longer and spreading the investment out gradually carries lower risk but often produces lower returns than lump-sum investing, especially over longer periods. For bitcoin, Is bitcoin DCA worth it? DCA vs lump sum in two real markets shows which way it tilts: DCA comes out ahead when the price falls first and then recovers, and the lump sum comes out ahead when the price climbs steadily.
Can you DCA money you'll need in two or three years?
Read the table backwards: write down the earliest year you'll need the money, then find the matching row. For money needed within two years, roughly one start month in four in this data was still down at the end, and the worst group was left with just over half; for money needed within three years, losses were far less common, though the worst group was still down 13.0%.
The most recent groups are on the loss list too. The nine groups that started between February and October 2024 reached 24 months between January and September 2026, and all nine were down; the groups that started in July and August 2023 were still down after 36 months.
A house deposit, tuition, a debt due in a few years: put money with a fixed due date in here and the result rides on the price in that one month. That money belongs somewhere else first. DCA money is what's left after the emergency fund, money you won't touch for several years. How much of that can go into crypto is a position cap you can work backwards from the biggest drop you can live with.
The planned end date isn't a hard stop either. If the money isn't needed yet and the position is still under its cap, you can keep buying; in the year or two before you need the cash, you can sell in monthly slices the same way you bought, instead of unloading the whole position in a single month.
What the backtest leaves out, and how to rerun it for your own plan
Does this bitcoin DCA backtest include trading fees?
No. Every purchase is treated as filling exactly at the month-end close, with no fees or spread taken out, and a real order won't land precisely on the close either. FINRA's guide to dollar-cost averaging warns that if you pay commissions or other fees on each transaction, DCA may cost more in fees than a lump sum because of the larger number of trades.
If I paused my DCA for a few months, do these numbers still apply?
Every group in the table bought in every single month from its start month. Skip some months and both the average cost and the end result change, so the figures can't be applied directly; how much they change depends on which months you skipped and for how long. To check your own plan, take the amount of bitcoin you actually bought, value it at the closing price of your end month, and compare that with what you actually put in.
Where can I find bitcoin's historical monthly closing prices?
Binance's public market data API returns them directly: the endpoint is /api/v3/klines, with symbol BTCUSDT and interval 1M for monthly candles, and each candle includes its open and close price. Without the timeZone parameter, months are split in UTC; with it, they follow the time zone you set. The first monthly candle available for BTCUSDT is August 2017.